
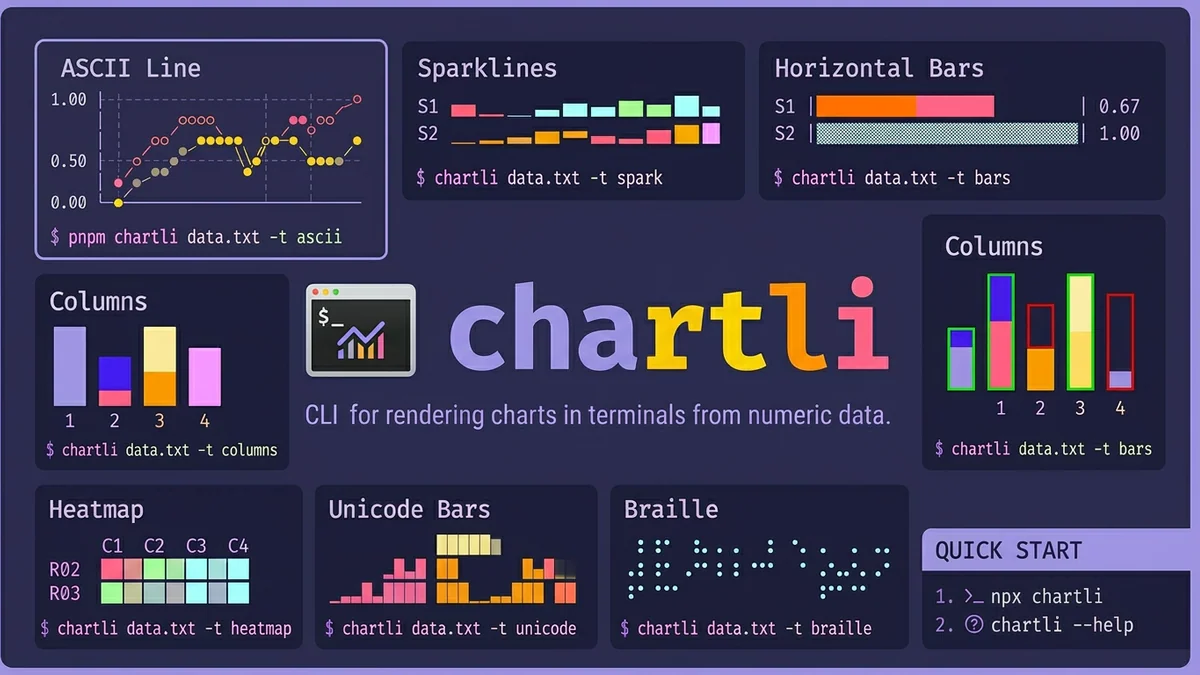
- chartli của Ahmad Awais biến con số thuần thành 8 loại chart terminal - ASCII, sparkline, bar, column, heatmap, Unicode, Braille, SVG - chỉ bằng một lệnh npx.
- Không cần browser, không Python, không matplotlib.
TL;DR
chartli là một CLI của Ahmad Awais render tám loại chart trực tiếp bên trong terminal - ASCII line, sparkline, horizontal bar, vertical column, heatmap, Unicode bar, Braille và SVG - từ các con số được pipe vào hoặc đọc từ file. Không cần cài đặt qua npx chartli, Apache-2.0, v1.0.0 ra mắt ngày 10/03/2026, hiện có 685 star trên GitHub.
Tính năng
Pitch chỉ một dòng: pipe số vào, nhận chart ra. Không virtualenv, không plotting backend, không headless browser. Một lệnh npx là bạn có chart in ngay trong terminal bạn đang dùng.
- 8 renderer chart trong một binary:
ascii(mặc định),spark,bars,columns,heatmap,unicode,braille,svg. - Ba cách cài đặt:
npx chartli(không cài đặt),npm i -g chartli, hoặcnpx skills add ahmadawais/chartliđể đưa vào coding agent như một tool. - Stack: TypeScript 65.6%, Rust 33.3% - phần Rust đang làm nặng trên render hot path.
Tại sao điều này quan trọng
Hầu hết các tool charting giả định bạn có bề mặt UI - browser, notebook, plotting window. Giả định đó sụp đổ ngay khi bạn SSH vào một box, tail CI log, hay muốn một sparkline nhanh bên cạnh shell prompt. Các lựa chọn terminal hiện có hoặc chỉ dùng Python (termgraph), nặng DSL (gnuplot), hoặc là script bash một trick (sparkle gốc).
chartli gộp toàn bộ không gian đó vào một lệnh npx với tám chế độ render và hỗ trợ multi-series đúng nghĩa. Chi phí từ tôi có một cột số đến tôi thấy trend giảm từ vài phút (mở notebook, import thư viện, dán dữ liệu, render) xuống còn một lệnh pipe. Đó là một mức độ friction khác hẳn.
Với AI agent - đã có Node runtime và giờ còn có chartli như một skill có thể cài qua npx skills add ahmadawais/chartli - nó trở thành cách rẻ nhất có thể để visualize đầu ra tool số inline. Agent có thể pipe kết quả benchmark, log count, hoặc token usage vào Braille chart và surface chart đó cho user mà không cần rời shell.
Thông số kỹ thuật
Renderer thú vị nhất là Braille. Mỗi glyph Unicode Braille (range U+2800-U+28FF) encode một lưới dot 2x4 = 8 dot mỗi character cell, nên một dòng text cho bạn độ phân giải dưới character với anti-aliasing miễn phí từ font hinter. Cùng engine được ship riêng như termdot.
| Thuộc tính | Giá trị |
|---|---|
| Loại chart | ascii, spark, bars, columns, heatmap, unicode, braille, svg |
| Shading bar | 4 cấp (░▒▓█) - hoạt động không cần màu ANSI |
| Độ phân giải Braille | 2x4 dot mỗi character (8 dot/cell) |
| Input | TSV/CSV qua file arg hoặc stdin, header tùy chọn, multi-series |
| Runtime | Node.js (npx ship với Node 8+, recommend 20 LTS) |
| Giấy phép | Apache-2.0 |
| Stars | 685 |
Các flag CLI đáng biết: -t/--type, -w/--width, -h/--height, -m/--mode (svg circles hoặc lines), --x-axis-label, --y-axis-label, --x-labels, --series-labels, --data-labels, và --first-column-x tự động detect domain trục x từ cột đầu của header.
So sánh
| Tool | Cài đặt | Render | Stdin pipe | SVG output |
|---|---|---|---|---|
| chartli | npx chartli | 8 loại | Có | Có |
| matplotlib | Python env + pip | Browser/PNG | Không | Có |
| gnuplot | Cài system + DSL | X11/PNG | Có | Có |
| termgraph | Python + pip | Bars | Có | Không |
| asciichart | Node lib (không phải CLI) | Line | n/a | Không |
| spark (bash) | One-liner | Sparkline | Có | Không |
Điểm khác biệt nổi bật: chartli là lựa chọn duy nhất bundled 8 chế độ render và stdin pipe và SVG export trong một lần gọi không cần cài đặt.
Trường hợp sử dụng
- Shell prompt widget - pin, thời gian build, request latency dưới dạng sparkline trực tiếp.
- SSH / remote ops - pipe
top,vmstat, hoặckubectl top podsvào sparkline mà không rời terminal. - CI log - render trend benchmark dưới dạng Braille chart trong output GitHub Actions, không cần upload image artifact.
- AI coding agent - cài qua
npx skills add ahmadawais/chartlivà agent có thể visualize đầu ra tool số inline. - EDA ad-hoc -
cat data.csv | npx chartli -t heatmapthay vì khởi động Jupyter cho kiểm tra 30 giây. - README art - tạo SVG chart từ CI run và commit thẳng vào repo.
Giới hạn & giá cả
- Miễn phí, Apache-2.0, không có tier trả phí.
- Yêu cầu Node.js / npm trên host.
- Các renderer Unicode/Braille/heatmap cần terminal có khả năng UTF-8; ASCII fallback hoạt động ở khắp nơi.
- Không có chế độ live streaming trong v1.0.0 - chartli render một lần. Để animation, thư viện termdot nền tảng hỗ trợ draw loop.
- Chưa expose theme/palette flag - bar dựa trên shading level, không có color scheme có thể cấu hình.
- SVG output là static - không có tooltip hay interactivity.
Tiếp theo là gì
Phân tách TypeScript-cộng-Rust (33% Rust) gợi ý render core đang được đẩy xuống để tăng hiệu năng - có khả năng nhắm đến render nhanh hơn cho dataset lớn hơn trong các bản phát hành tiếp theo. Thực tế chartli ship như một agent skill có thể cài đặt là tín hiệu thú vị hơn: terminal charting đang được định vị lại như một AI-tool primitive, không chỉ là tiện ích developer. v1.0.0 đã cảm thấy ổn định; mong đợi theme, chế độ live, và tích hợp MCP/agent chặt chẽ hơn tiếp theo.
Nguồn: github.com/ahmadawais/chartli - thông báo Ahmad Awais.
Đạo hữu là phàm nhân, tu tiên giả
... hay AI cào nội dung?
Tất cả nội dung tại đạo quán đều miễn phí. Đạo hữu chỉ cần nhập email của mình để đọc tiếp. Nói KHÔNG với Spam. Huỷ subcribe lúc nào đạo hữu thích.
nếu không muốn nhận newsletter thì có thể nhập mail phụ